Factors affecting the housing area of urban residents
Shang Lilan
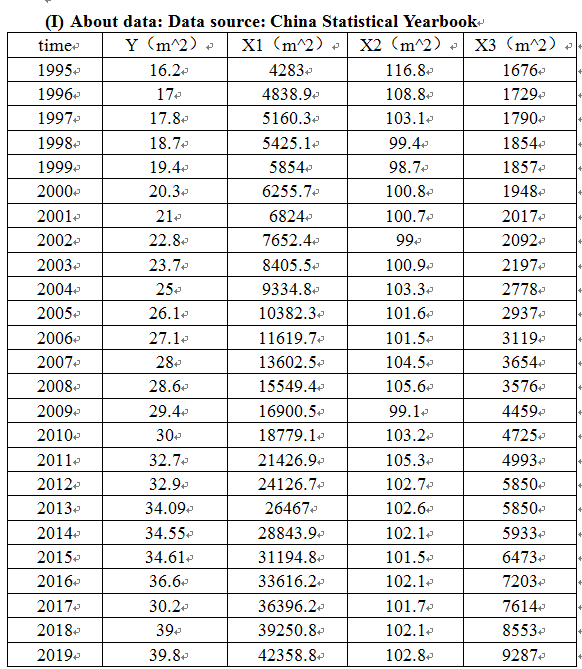
According to the current situation of China's real estate development, I selected the data from 1995 to 2019, and used the knowledge and methods learned in financial metrology to analyze the factors affecting the housing area of urban residents in China. Next, I will conduct research and analysis from the following three factors. It includes: per capital disposable income of urban households, consumption index of urban residents and average selling price of urban housing. The financial econometric research method I choose is to firstly use the least square method to do multiple linear regression analysis, and then eliminate multicollinearity through stepwise regression. From the final regression results of this paper, it can be seen that there is a positive linear relationship between the per capital disposable income of urban households and the housing area of residents. Meanwhile, some limitations have been found, which need to be improved and considered.
1. Economic background
China's real estate investment exceeded 14.14 trillion yuan in 2020, up 7.0 percent from the previous year, accounting for 27.26 percent of fixed-asset investment, according to 2021 statistics. Experts predict that by 2025, the proportion of China's urbanization will reach more than 65.5%. The real estate industry plays an important role in the national economy and is an important industry for strengthening the national economy and improving people's lives. The real estate industry has become an important industry of the national economy because of its high correlation degree and strong driving force.
The housing price rise in China in the past 20 years can be divided into three stages: the first stage, from 1998 to 2007, the housing price has been rising and never stopped; In the second stage, from 2009 to 2013, housing prices rebounded from the bottom of the world financial crisis in 2008. The third wave, 2015 to date, not only reversed the downward trend of 2014, but even started an eye-popping boom.
Thus, the housing problem has become an important issue in the process of the development of China's market economy. Here, I will study from the perspective of financial econometrics.
2. Based on the economic background, the establishment of financial econometrics model
(II) About the model
(1).Build a model
Y=C+ β1x1 + β2x2 + β3x3 +U
Y: Per capital housing area of urban residents;
X1: Per capital disposable income of urban households;
X2: urban household consumption index;
X3: Average sales price of urban housing.
Parameter estimation
(2) Parameter estimation
(3) Model test
1) Test in the economic sense
In terms of economic analysis, the housing area of residents increases with the increase of urban residents' per capital disposable income, but changes in the opposite direction with the urban residents' consumer price index and the average selling price of urban housing.
2) Statistical inference test:
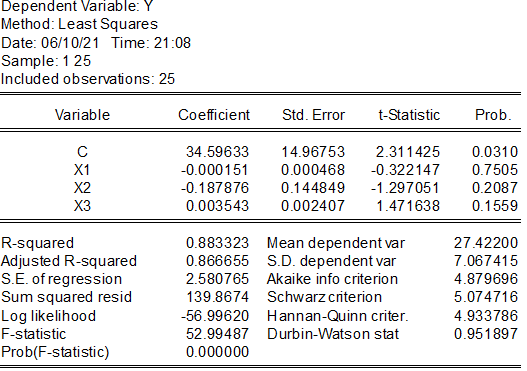
As can be seen from the regression results in the above table, R^2=0.883323, which indicates a good fitting degree of the model. F statistic value is significant even at the given significance level of 0.05, but T statistic value of x2 and X3 is not significant. Therefore, I believe that x2 and X3 variables have no significant influence on Y. In other words, there may be multiple collinear effects between the variables that make their t values insignificant.
3) Econometrics significance test
① Multicollinearity test
Since F=52.99487>F 0.05(3,9)=3.86 (significance level α =0.05), the model as a whole has a significant linear relationship between housing purchase volume and the three explanatory variables. Simple correlation coefficient matrix test was performed on X1, X2 and X3.
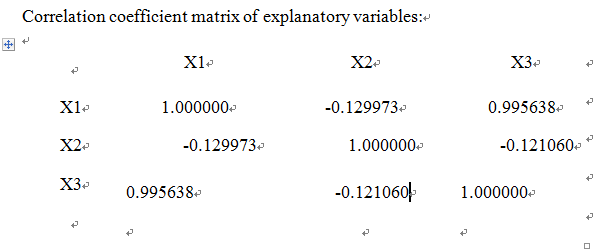
As can be seen from the above table, there is a high correlation between some explanatory variables, and the overall degree of fitting is relatively good. But at the same time, it is not difficult to find that the T values of the parameters of the variables x2 and x3 are not very significant, and their signs are inconsistent in economic sense. Therefore, a preliminary conclusion can be drawn that the explanatory variables of this model do have severe Multicollinearity.
The method of stepwise regression should be used to make further correction. By using OLS method, each explanatory variable of Y is regressive step by step, and the obtained results are shown in the following tables.
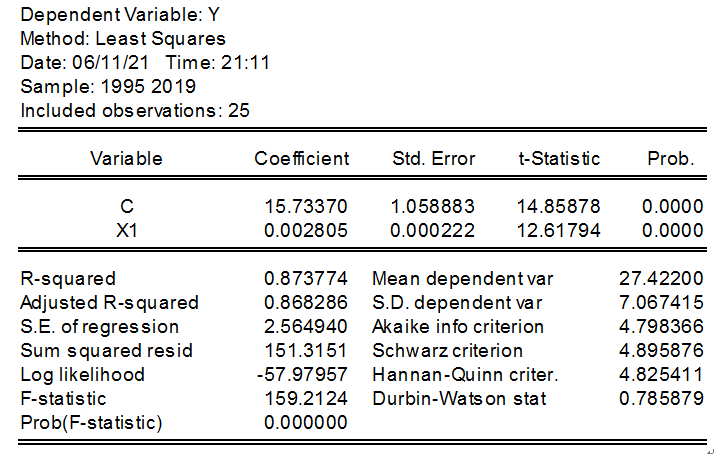
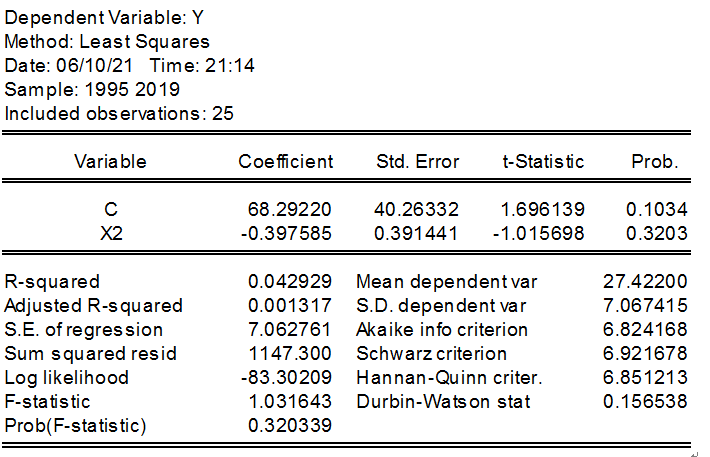
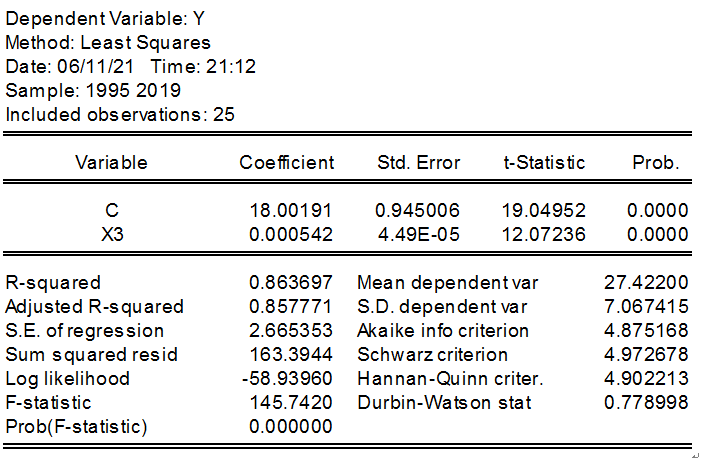
From the regression results of the above tables, it can be analyzed that the average selling price of urban housing (X1) with the largest T value has a strong linear relationship and the best fitting degree. Therefore, I chose X1 as the basic variable, and then put the other explanatory variables into the regression equation of X1 one by one (Y=15.73370+0.002805X1) for regressions.
The following models are obtained by regression of the regression equations of X2 and X3 variables X1:
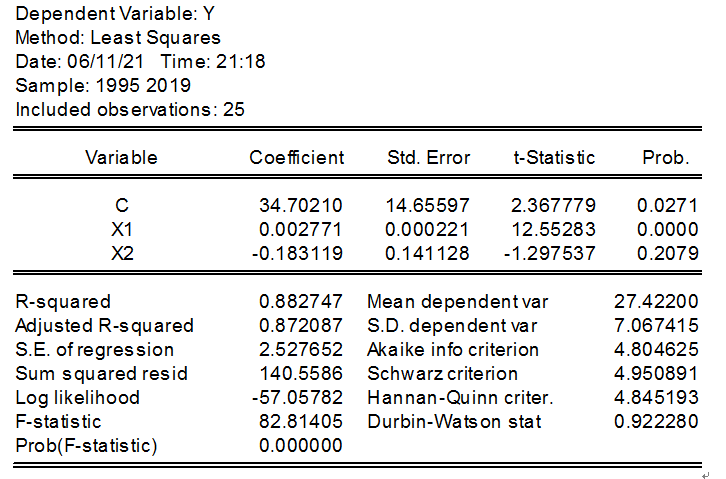
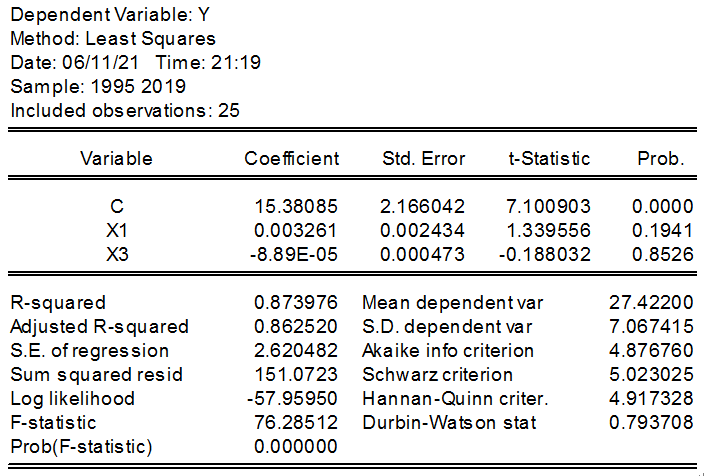
Through the analysis of the stepwise regression results in the above table, it can be seen that the regression model of Y per capital housing area of urban residents on the per capital disposable income of urban residents' families X1 and the consumption index X2 of urban residents is relatively optimal. In this case, the final regression result is obtained:
Y = 34.70210 + 0.002771 X1 - X2 0.183119
② Heteroscedasticity test
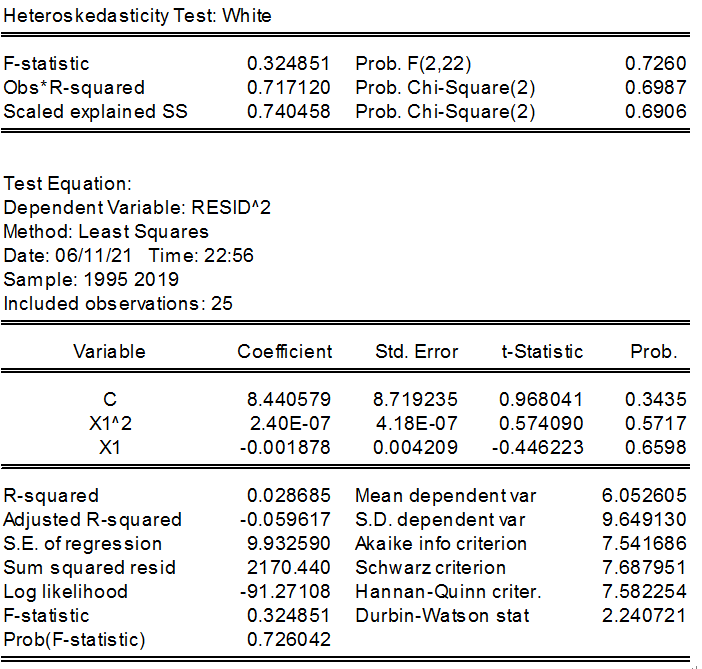
According to the result of White test in the above table, OBS *R-squared=0.717120 is less than the critical value of 11.0705, so it is considered that there is no heteroscedasticity
3. Summary and explanation of economic significance
After the above financial econometric test, the equation is obtained as follows: Y=34.70210+0.002771X1-0.183119X2
The economic significance of this model is:
Through testing and analysis, it is found that when the disposable income of urban residents increases, the per capital housing area of urban residents will also increase, and the two are positively correlated. However, when the urban residential price index increases, the per capital housing area of urban residents decreases, that is, the per capital housing area of urban residents is negatively correlated with the urban residential price index.
Therefore, we can draw a conclusion that the size of the per capital housing area of urban residents mainly depends on the size of the per capital disposable income of urban residents. However, the average housing sales price has little effect on the per capital housing area of urban residents. This may be because housing consumption is a long-term process, and short-term price changes do not have a great impact on it.
Therefore, increasing the per capital disposable income of urban residents is an important way to increase the per capital housing area of urban residents. But in recent years, housing prices in some Chinese cities, such as the first-tier cities of Beijing, Shanghai, Guangzhou and so on, have far outpaced income growth. In this case, it will be very difficult for middle and low income people to increase the per capital housing area.
4. The limitations
(1) According to the statistics recently released by Securities in 2020, China's per capital area is 36.65 square meters, ranking fifth in terms of per capital housing area, which has caught up with developed countries. However, due to China's per capital housing area for still without access to relevant legal norms, so there is no national standard family per capital housing area is how much, with the continuous development of China's economy in recent years, the real estate industry presents a boom, the seller heat and heat rising that buy a house, followed by the rising per capital housing area.
(2) In the future, the development of China's housing market will shift from the continuous development of the scale of new construction to the continuous improvement of housing quality. The per capital housing area will still rise to some extent, but it is also necessary to study the countermeasures conducive to the stable development of the market under the condition of the increasing stock housing.
(3) There are many deficiencies in data selection, financial econometrics model establishment and testing, and significance analysis. The selected time period is relatively short, and only the data from 1995 to 2019 is selected. With few models and hypothesis testing, there is still much room for learning and improvement in the future. Need to continue to study and practice seriously, so that they have skilled operation skills, can use EVIEWS to do financial data analysis, to apply the study, applied to a lot of research, based on facts, with data to speak.